How valuable are physiological performance tests for predicting your Ironman potential?
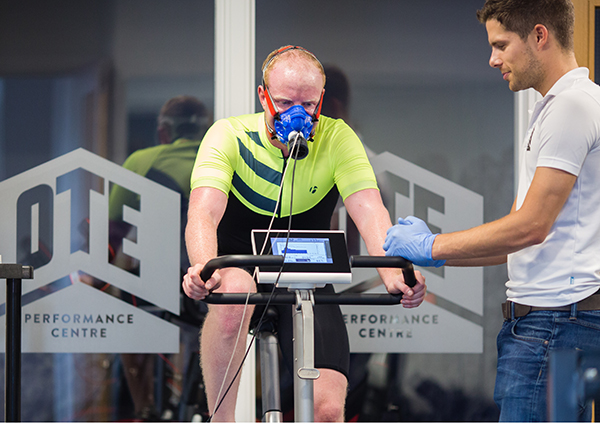
220’s Staff Writer Jack Sexty headed to OTE’s Performance Centre for a full physiological test ahead of his m-dot debut in Lanza. but how well can lab numbers predict performance? Over to our lab rat…
As endurance sport becomes more and more scientific, with Team Sky’s ‘marginal gains’ programme at the forefront, it’s no surprise that triathlon has followed suit given the increasing level of competition and popularity of the sport. With triathletes at all levels investing much time and money into their training and equipment, 220 were keen to see if a physiological assessment could lead to performance improvements – and to find out what you can actually learn about your athletic potential in the lab. I visited the performance centre of sports nutrition brand OTE, playing guinea pig ahead of my Ironman debut in Lanzarote. Here’s what went down…
Jack the guinea pig
I’m greeted by OTE founder Pete Slater and head sports physiologist Craig Stevenson, who prepares the equipment in order to take a full body composition analysis. A skinfold measurement is taken to establish body fat percentage, which is highly detailed as measurements are taken at various points of the body. A blood sample is taken to establish haematocrit levels (the percentage of red blood cells to total blood) and haemoglobin (the grams per litre in the red blood cells, that are responsible for carrying oxygen from the lungs). A base heart rate and lung volume measurements are recorded, which completes the body composition analysis.
A bike was then set up for me to perform a CPET (cardiopulmonary exercise test), which is a ramp test performed to failure in order to establish my key metabolic thresholds. After more than 15mins of steadily increasing effort, I can take no more and Craig takes the final readings. A general physiological test overview plus numerous graphs to show the data are generated, after which I’m ushered into the office for a full consultation and breakdown of what the results mean.
Dissecting the data
The body composition analysis is discussed first, which starts with a huge ego boost as I’m told I have the metabolic age of a 15-year-old! This is quickly countered by news that in order to be at ideal race weight, I’d need to shed at least 4kg from my current weight of 77kg. “You could knock a minute off your 10km run time just by losing that weight, without making any fitness gains at all,” Craig says matter-of-factly.
The skin fold measurements show my total body fat level is 12.8% – it would need to be around 6% to reach full athletic potential, although for a non-pro 8% is a more sustainable figure to aim for. My daily metabolic rate is 1,954kcals, and I’m told to sustain me over an Ironman I’d need between 60-80g of carbohydrates per hour.
Haematocrit levels show I’m in the upper quartile, with 45% of red blood cells to blood volume. This figure can be a good indication of a person’s predisposition to endurance sport, but in actual fact it only becomes important with top-end elites, where genetics can start to play a part: “There are plenty of elite athletes with lower haematocrit levels than this, and it can also change day-to-day,” Craig explains. “As you get fitter your blood plasma volume increases, so it can actually go down.”
Resting heart rate is 46bpm, and lung volume was 4.88 litres with an FEV1 (how much air exhaled in the first second of exercise) of 4.59 litres per minute. The FEV1 can give a good indication of an athlete’s functional lung capacity.
The figures everyone wants are threshold numbers: my V02 max is recorded at 63ml/kg/min. VT1, or the First Ventilatory Threshold, is the point where your anaerobic metabolism starts to increase at a greater rate than the aerobic system. This doesn’t mean you’re working anaerobically but are starting to. My VT1 point expressed in watts is 242.
VT2, the point at which anaerobic threshold is reached, is 375 watts. Craig explains that for endurance sport, particularly Ironman, this figure is less of a concern as you would never want to hit anywhere near VT2 in a race (which is why, coincidentally, it’s useful to know). My functional threshold power, or the highest sustainable over 45-60mins, is 318 watts.
The test also shows I’m unable to fully plateau at the end, although it felt as if I couldn’t go on – “In layman’s terms, you’re a bit soft,” Craig tells me, which is fairly normal but can point to a slight lack of mental toughness, as well as possible fatigue on the day of the test and a lack of high-end conditioning.
While the numbers expressed as watts and V02max is what everyone wants to know, it’s also important to know the percentage of max an athlete can operate at in order to decipher athletic potential, and mine is a mixed bag:
“You start working anaerobically at 60% of V02max, which means you’re not near full athletic potential yet. The idea is to get this discrepancy as close together as possible.
“Elite athletes can work at around 85% of max,” Craig continues, “and most of us will be capable of getting to at least 75%.”
Craig tells me that for my Ironman bike, the make-or-break section, I should keep to a power plan of around 220 watts. Considering the VT1 power number (242 watts) riding at comfortably under should ensure there’s something left in the tank for the run, assuming I’m well trained for the distance. Trying not to tip over my threshold of 318 watts at any point will be challenging due to the hilly course, but it’s advised to try to keep fluctuations to a minimum.
Sport-specific
While numbers from performance testing can give a good indication of what an athlete is capable of, specificity is key, and Craig explains many extraneous variables can affect performance: “Numbers from a test can give a great indication of what you’re capable of, but for Ironman especially you won’t stand a chance unless you’re conditioned to it. This is where training periodisation comes in. You can train in cycles, whereby you use some weeks to improve your numbers and other weeks where your overall fitness might not improve, but you’re conditioning your body to get used to your particular event. A short-course triathlete may have fantastic fitness and could put out impressive numbers, but they could get beaten in an Ironman by someone with far inferior test results because they have the leg miles.”
And it’s not just volume: nutrition, preparation and much-neglected factors such as bike handling can make or break a race, and if any part isn’t well-drilled for yours the numbers can start to become less important:
“Recently we had a pair of elite cyclists coming in for testing, who reportedly rode to exactly the same power, but one is getting podiums at races and the other is yet to finish a World Tour event. This is where it gets difficult to rely completely on power profiles, because other variables in sport, such as bike handling in this case, can always play a part. So you could have an ITU athlete riding in a group who gets dropped purely because their bike handling skills are worse, but the power output could actually be identical or greater than the riders who’ve managed to break away. Physiological profiling gives a snapshot of your fitness, but in a technical sport like triathlon many factors have to gel together in order to perform as your test results would suggest.”
So did everything go to plan in Lanzarote?
“I arrived in Lanzarote full of beans, said Jack, but deep down knew I probably hadn’t put in enough iron-specific training and didn’t have the true long-course experience to achieve the results I was physiologically capable of according to Craig’s testing.
“The swim was a scrap in the first lap due to my poor positioning, which meant wasting energy. I used a power meter and attempted to keep to the 220-ish watts Craig suggested on the bike; but there’s no substitute for course knowledge, and I found this was perhaps my downfall as I was totally unprepared for the last climb at 110km. After this I was worried about blowing up, and the power average ended up being 194 Watts for the 180km. My bike handling also let me down, and other athletes were flying past on the descents; practising this could have saved me loads of time without needing any extra power at all!
“At the start of the marathon I held 8mins/mile, but this slipped away dramatically because I most likely under-fuelled on the bike. This could also be a mental toughness issue, as shown on my ramp test, because I wasn’t able to fully max out. The heat, fear of cramping and lack of fuel led to the second half being tackled in survival mode, using a run-walk strategy to finish in 12:32hrs – much slower than predicted but I was pleased to finish.
“From my own experience, physiological testing can give a great indication of what you could expect, but many factors need to fall into place. A lab test can’t tell you when to eat or how many miles to put in during training, so if you decide to get your own test take full advantage of a consultation afterwards, and with the experts, like the good people at OTE, come up with a training and race fuelling plan to ensure your potential is realised!”
The coach’s viewpoint
Vastly experienced triathlon coach Mark Kleanthous gives his summary on Jack’s performance and provides tips for improvement
Jack may have been disappointed with his Ironman race because his lab results suggested a stronger bike performance, which would allow him to run a sub-4hr marathon. His OTE test provided lots of useful information, including daily metabolic rate of 1,954cals, or 81cals per hour. The ramp test was completed at a similar humidity to Lanzarote, and the fluid loss results could have told him how much was needed on race day. His resting HR of 46 to a max of 190 gave him a HR reserve of around 144bpm.
Going off too fast in the swim would have resulted in slowing down after 8-9hrs, and looking at the splits this may have been the case. After the swim, Jack needed to focus on keeping within his heart rate zones and riding comfortably for the first 90mins. Jack also needed to eat little and often, aiming to take in 240-300cals per hour (around 60g of carbohydrates). Avoiding flavour fatigue is important, and eating similar products for the whole course could have discouraged him from eating. He needed to consume enough calories for the 6.5hr bike (between 1560-1950cals), and as it took him longer than expected he probably fell short. This should have been accounted for and practised in training at predicted Ironman race effort, keeping heart rate below threshold for the duration. The IM Lanzarote bike course is particularly challenging due to the climbs and windy conditions, making it particularly difficult to eat little and often. This can be practised on windy days in the UK to part-replicate the conditions.
Jack said nearly all of his run training was faster than IM race-pace, so he found it hard to dial into a slower marathon. He likely slowed from not consuming sufficient calories, and said he switched to coke from the aid stations. To get 240cals per hour he would have needed almost two cups per hour (IM aid stations typically provide 100ml half-cups of coke), along with a further 200ml of water to take on enough fluid. Athletes need to be aware of quantities when using aid stations to keep to their nutrition strategy.
Jack’s training was probably more suited to half-distance, and he pointed to a lack of bike miles and long, steady runs in training. He said he ran a marathon eight weeks out from the race, whereas I wouldn’t advise doing this within 24 weeks of an iron-distance event for a first-timer. Long rides/runs needed to be completed at the predicted iron-distance race pace according to the test results, consuming his recommended calories (240) per hour.
In summary, long-course success is determined by our genetic make-up, how we specifically prepare, environmental factors on race day and our ability to focus on hydration and energy levels, while coping mentally with the demands of a long endurance race.
 220 Triathlon Team
Journalists, reviewers, coaches and athletes
220 Triathlon Team
Journalists, reviewers, coaches and athletes