Which is more painful: running, riding or rowing? We tested in a lab
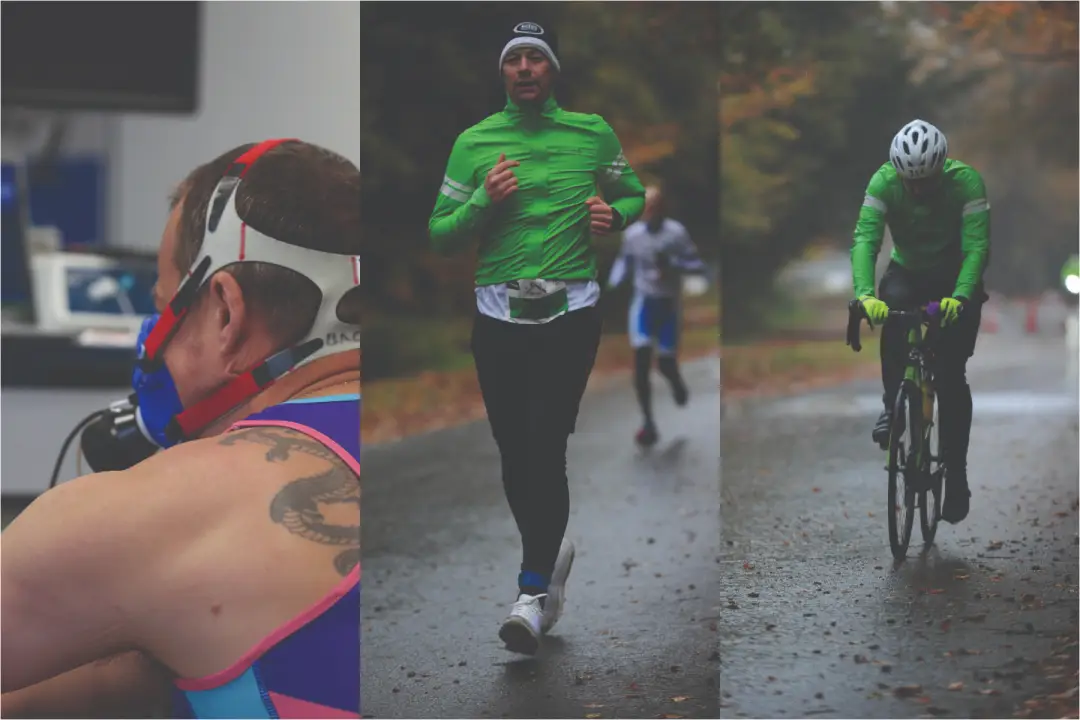
Is there any truth to the adage ‘no pain, no gain’? Is one tri discipline harder than the others and how hardcore exactly are triathletes? Steve Shrubsall masks up in the lab
Call me a masochist, a dopamine junky, or happily answer to all of the above – but I love nothing more than to find myself teetering on the verge of complete physiological breakdown.
Yes, this might sound strange, but as someone who is more or less addicted to endurance sports, it’s also a rite of passage.
In order to progress beyond mediocrity in disciplines such as running, rowing and cycling, learning how to suffer and then being able to embrace the pain is arguably the sharpest arrow you can add to your quiver.
Once you are no longer fearful of taking your mind and body on a kamikaze voyage through darkness, despair and abject misery, life conversely becomes a lot easier. Pain, as they say, is inevitable while suffering is optional.
With this mantra firmly at the front of my mind I decided to add to the general unpleasantness of last winter by attempting to ascertain which endurance activity elicits the most pain.
Setting the benchmarks
Running, cycling and rowing are arguably the three most popular endurance sports in the UK. Albeit rowing isn’t swimming which most triathletes will be including here, but for the purposes of this experiment rowing offers a more relevant comparison. Row, bike, run? It could catch on…
Happily, three of these sports’ standard race distances all more or less take the same amount of time to complete.
The 5km run to the initiated could only be considered a pleasant experience if you aren’t trying to smash your PB in half – and 5km runners are always trying to smash their PB in half.
It usually takes me 21 minutes to complete my local parkrun and it’s usually around the 2km mark that I wish I was still in bed.
Likewise, the 10-mile time trial on a bike is a pursuit which when undertaken full gas could be mistaken for an elaborate form of torture.
Again, this takes me around 20-21 minutes to complete.
Lastly, although there’s a special place in hell reserved for the 2km rowing TT it only takes around 7 minutes (on a very good day) for me to finish – so I assigned the 5km row – my current PB is 18.29 – as the final test in my pursuit of pain.
How to measure which sport is hardest

But how would I objectively be able to measure this?
Suffering – as the mantra alludes to – is in the eye of the beholder. It’s easy to gloss over the agony after the event – the brain has a cunning way of pixelating pain and focusing on the hit of pure dopamine that follows a really gruelling workout.
Therefore, simply opining that one particular workout is harder than the others wouldn’t yield an accurate result. Videoing the session could be an option – I’d gauge facial contortions, look for signs of acute physical distress: going cross-eyed, nosebleeds, vomiting episodes et al.
Again, though, spraining my face, as good a barometer of effort as it is, would largely be subjective.
Our suffering metrics
In the end I decided on five different metrics to gauge the pain:
- Heart rate: I’d look at my average heart-rate over the course of the entire activity and note the maximum reading for each. The closest to my overall max HR (around 192bpm) would be a pretty accurate way of ascertaining a winner.
- Rate of perceived exertion: Good old RPE is definitely more of a subjective way to measure the effort but I’ll grade my pain scale out of 10 during the final five minutes of each exercise as a means of coming to the most clear-cut conclusion.
- Lactate readings: This is the gold standard of pain measurement. A lactate reading directly after each session will open an objective window into exactly how hard I’ve been trying and how much pain I’ve been in. While lactate isn’t the direct cause of discomfort during exercise when the build- up becomes too great for the body to be able to reuse it as energy, byproducts like hydrogen ions accumulate and create that acidic discomfort in the muscles. Therefore, the higher the lactate reading at the end of the workout, the more it has evidently hurt.
- Oxygen uptake and CO2 production: This is a metric that I was loath to include in this little list of horrors, but it’s a perfect indicator of cardiovascular upheaval. Oxygen and carbon dioxide rates would be measured for each of the tests via a metabolic mask. This introduces a whole new level of discomfort to proceedings – both mentally and physically.
- Carbohydrate usage: How much carbohydrate would be called into play to power my muscles through each effort.
Enter the pain cave
With the hows and the whys now in place, it was time to enter the pain cave. The pain cave in this instance was a sports science lab in Farnham. One Track Run Club is owned by Anthony Fletcher. It was his expertise I’d be employing to make sure all test results were accurate.
Test one: the run

After a resting lactate reading had been taken I put on the metabolic mask and Fletch asked me to perform a lung function test.
In healthy individuals this should read somewhere between 0.9 – 1.4mmols. Anything over or below could indicate onset diabetes or in some cases cancer. I was relieved then to see 0.9 materialise on the lactate meter.
I completed a warm-up which went some way to acquainting me with an oxygen mask. No wonder Darth Vader was always perpetually pissed off. After setting the treadmill to a 1% incline, I toggled the speed up to 7.8mph / 12.5kph and set off in search of suffering.
Twenty minutes and a whole lot of heavy breathing and sweat later and the numbers were crunching…
Test two: the ride

Coming from a cycling background, this should theoretically be the test which would garner the most discomfort. I know exactly how hard I can push myself over a 20 minute duration on the bike – pain can certainly be practised.
While I’ve undertaken more than my fair share of 5km runs and 5km rows, it’s the 10-mile TT (usually around 20 minutes) that I’m able to break down forensically. My mind is able to tell my body that pushing this ridiculously high-intensity probably won’t kill me, despite how deeply unpleasant it might be.
But the mask was a bit of a leveller. It took me out of my discomfort zone, made things a little less familiar.
So, with my Canyon Endurace set up on a Wahoo Kickr Core turbo trainer, I set off once again unto the breach, with just the sound of my laboured breaths for company.
It was a dark 20 minutes, with seemingly less external stimulation than the run.
I fixated on a power number that my legs just couldn’t cash in. But my heart-rate suggested that I had very little left in the tank at the end of the effort.
Test three: the row
I tend to pick up rowing for a few months each year. I usually start in late October and culminate in a sweaty mess at the end of February. Having hired a Concept 2 Erg over lockdown I became obsessed with the 2km time trial.
For my money it’s probably the most unpleasant way you can possibly spend seven-odd minutes. It starts with a mix of wide-eyed fear and excitement. Then you seamlessly enter a kind of parallel dimension where everything is on fire.
But the 2k row is a little too short to compare to our other tests.
A 20-minute row at threshold, although not placing you in the purgatorial distress as its vindictive younger sibling, is still a task capable of eliciting some significant soul searching.
So once again, I masked up while Fletch took a resting lactate reading, grabbed the rower’s handle and tried to make the static boat move!
With each test now complete, a whole lot of data had been collected. It was time for Fletch to work his magic.
Oxygen consumption
On average the bike held a higher oxygen consumption than running and rowing. This means that energy burn rate was higher aka more grams per min of fuel being used.
Carbon dioxide production
On average the bike held a higher levels of CO2 production than running and rowing. The CO2 is being produced in the muscle and transported to the blood and then to the lungs.
Heart rate
For the first time we see the bike and run contending for first place. The running comes in slightly higher on average.
This suggests that despite the fuel usage being higher, more blood per min was needed for running to sustain the effort. This is probably due to the amount of muscle mass requiring energy and therefore more heat being produced.
Rowing was significantly lower across the board suggesting that the amount of blood needed per min through the heart was less. This is likely due to the frequency of muscle contractions being less.
Rate of perceived exertion
Heading into this test I had an open mind. But playing around somewhere at the back was the feeling that because cycling is the sport I’m the most familiar with, I’d have a psychological edge over the other two.
The ability to suffer in athletic competition is governed hugely by your brain. If you know you’re capable of a certain performance it becomes a far less daunting prospect to leave everything (save for your lunch) in the lab.
However, my RPE works in conjunction with Fletch’s data analysis to reveal quite a telling picture.
That my final level of perceived pain for the row was lower than both running and rowing. Yet the lactate was high at 6.8 m/mol. My heart rate was the lowest throughout all three tests, suggesting that rowing has the potential to be the hardest endurance sport.
On the other hand, running garnered the highest heart rate and the lowest lactate reading. This, Fletch told me, is a result of running relying on a more spring-centric style of movement, with less big-muscle recruitment than riding or rowing.
Therefore less lactate was produced over the course of 20 minutes.
Conclusion

So, which is the hardest of all three?
The results clearly indicate that cycling has the edge in all but maximum heart rate. Lactate, oxygen consumption, CO2 production and RPE all lean in favour of cycling.
The big muscle recruitment and the fact that the only thing you have to consider during the test is turning the pedal as hard as you damn well can, has made bike riding – for me, anyway – the hardest endurance sport of them all.
 220 Triathlon Team
Journalists, reviewers, coaches and athletes
220 Triathlon Team
Journalists, reviewers, coaches and athletes